Harmonograph
View this project on GitHub, or try it out.
Introduction
This program plots interactive Lissajous figures, acting as a digital harmonograph. You can specify two waveforms x(t) and y(t), parametrised by t. They are combined into a parametric curve, characterised by the points (x(t),y(t)). This curve is plotted on the square canvas in the top-left, and can either be animated, varying t with time, or static, with a customiseable range for t (the default is 2π).
The waveforms x(t), y(t) and x(t)+y(t) are plotted in the three canvases on the right, in that order.
A number of presets are provided. You will see that the intervals that sound more consonant also produce simpler, more visually-pleasing plots.
Screenshots
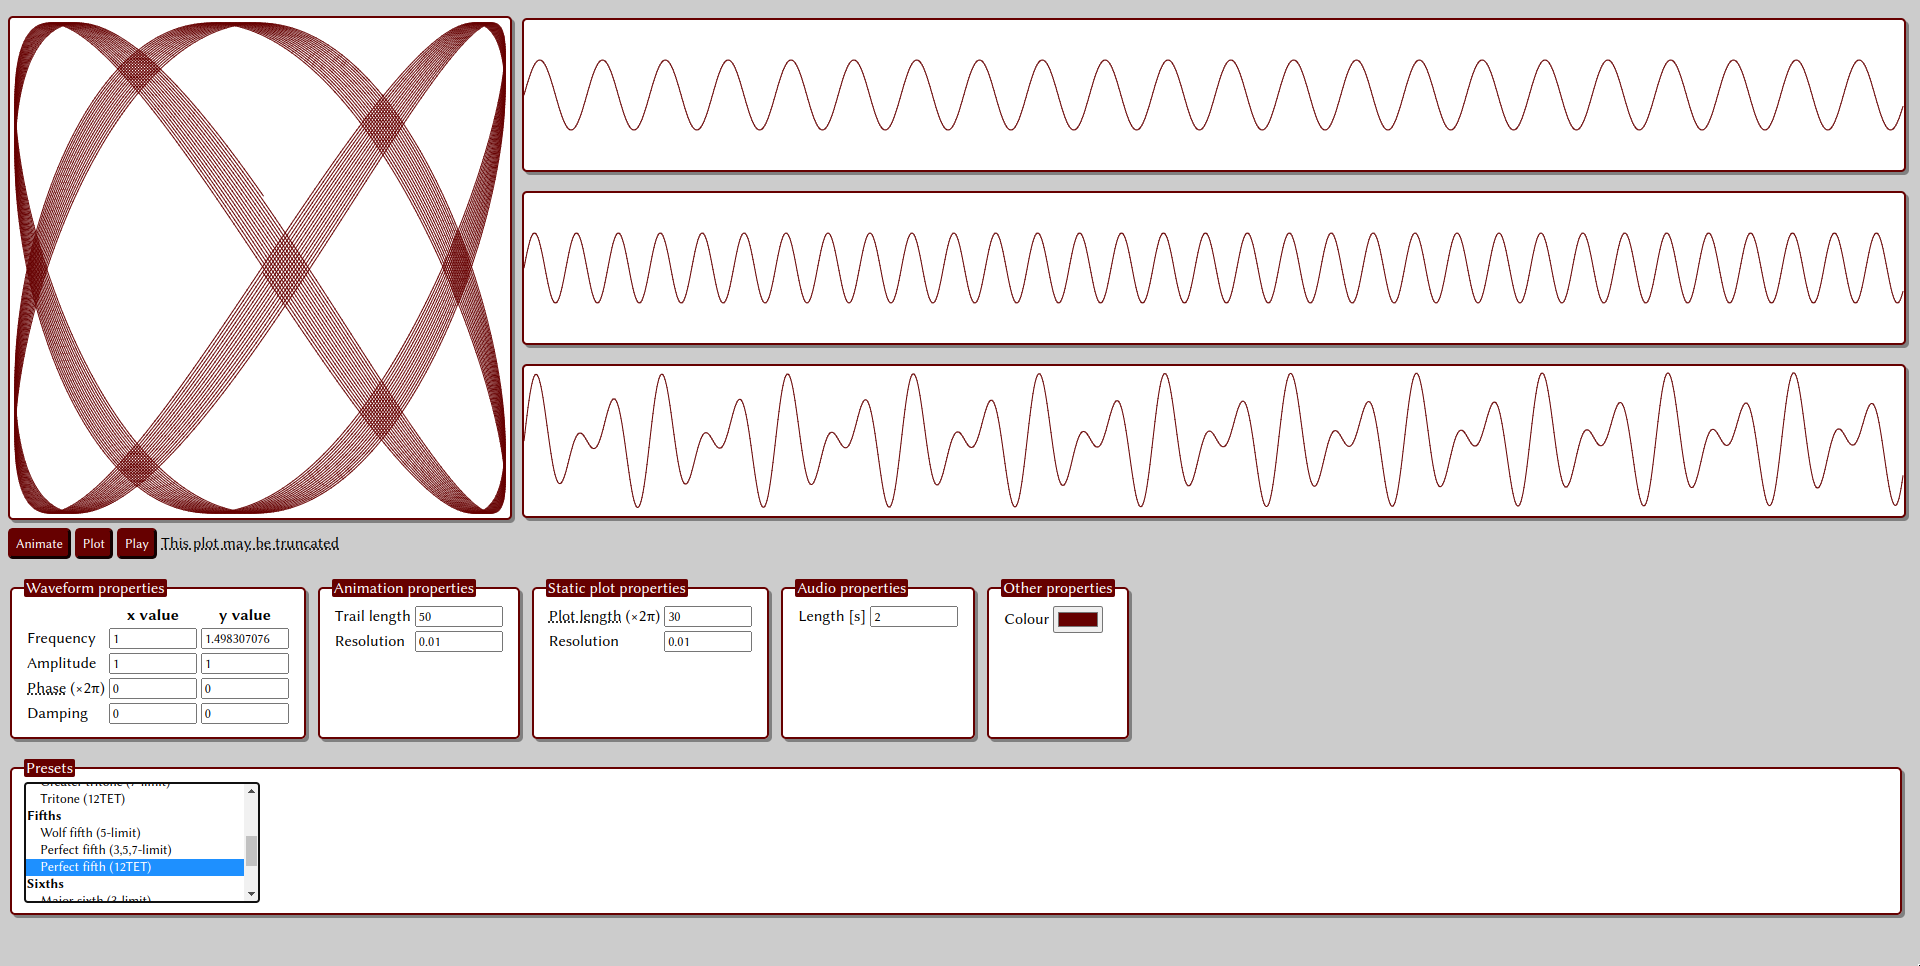
Perfect fifth in 12TET