Differential equation plotter
View this project on GitHub, or try it out.
This was a joint project with a friend who is very interested in calculus. He mentioned a numerical method for solving differential equations called Euler's method to me, and suggested that we create a program to graph differential equations. We implemented Euler's method in JavaScript and plotted some points on a canvas, first creating a primitive graph of ex, then sin(x), then more and more complex differential equations. I went home that night and advanced it, adding grid lines and input fields for various different values, and extending the graph in the negative direction. He derived a first-order differential equation for a ball rolling in a parabola, and I used the Lagrange-Euler equations to derive a second-order differential equation for a simple damped oscillator. We plotted these the next day and the graphs matched exactly what we expected them to.
Screenshots
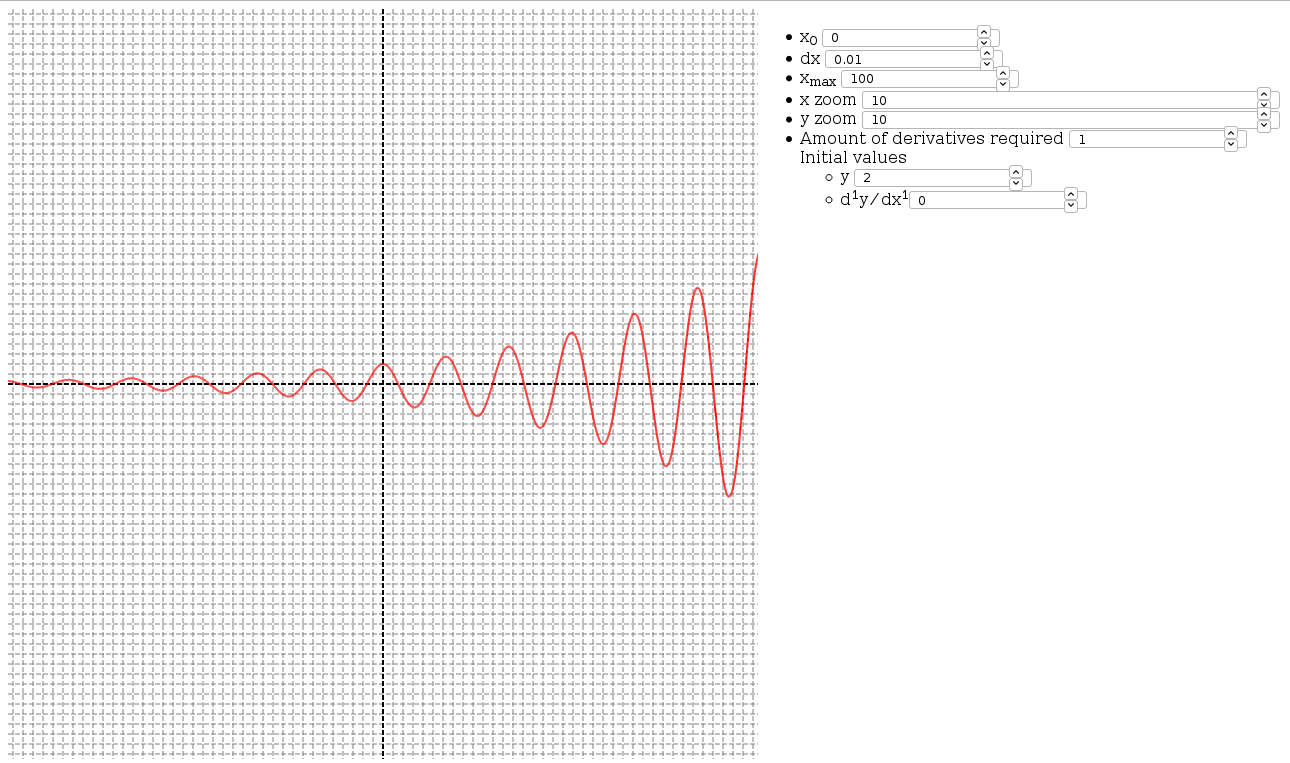
Plotter
To do
- Add the ability to pan
- Simplify UI
- User input
- Handle undefined values