Bézier
View this project on GitHub, or try it out.
Bézier curves are parametric curves that can be manipulated via a number of control points. A Bézier curve s is parameterised by 0 ≤ t ≤ 1 and is governed by n control points pi. It is defined by s(t)=Σi pi Bi,n(t), with Bi,n(t)=nCi ti (1-t)n-i.
This program plots interactive Bézier curves. You can add, move and remove points in order to control the curve's position, and you can also control the colour of the curve by modifying the points' colours, which are interpolated in much the same way as the position is: instead of working with points pi in canvas-space, work with points ci in colour-space.
Screenshots
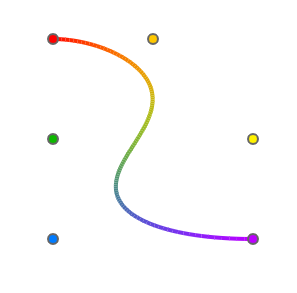
The default curve
Documentation
- Add a point
- A new point can be added by clicking in empty space on the page. The point will take the colour of the closest section of the curve.
- Move a point
- A point can be moved by clicking and dragging it.
- Delete a point
- A point can be deleted by shift-clicking it.
- Change a point's colour
- A point's colour can be changed by clicking on it, then using the colour picker widget that appears.